
One year ago, you stocked a pond with exactly 50% red fish and 50% blue fish. Today, you net some fish out of the pond, count the number of red and blue fish you net, and attempt to decide if one color of fish has survived better than the other.
What does it tell you if every fish you net is red?
The answer isn’t obvious
What if you only net one fish?
You stocked the pond with an equal number of red and blue fish, so you have no reason to expect your catch to be anything other than half red and half blue. One fish can’t be half red and half blue—neither can three fish or five fish for that matter. At some point 3/7 or 4/9 or 5/11 is going to be close enough to half, but what is that point?
How close can you expect to be to 50:50?
If netting one fish doesn’t prove anything, does netting two, even if they’re one of each color?
Does netting 6 red and 4 blue prove anything? Does it prove half as much as netting 7 red and 3 blue? How well does your net reflect the population of the pond?
A Statistical Model
A statistical model is a map of the way you expect things to be. If you’re reading this blog, you are probably attached to industry in some way, which means a statistical model is a very good map, because we aspire to eliminate all factors except random variation, and the models describe randomness perfectly.
If performance is affected by anything besides chance (if we’re deviating from the model), it’s something we want to know about and deal with.
Note: The models have parameters (randomness does not require a fair coin).
The bell curve is the most famous model …
But there are many. Here are a few so we can see what they have in common.
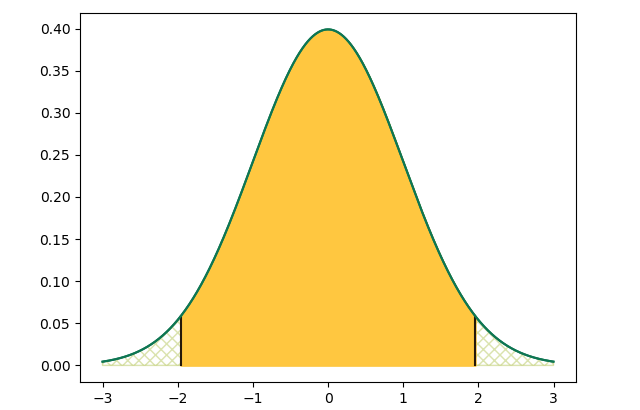
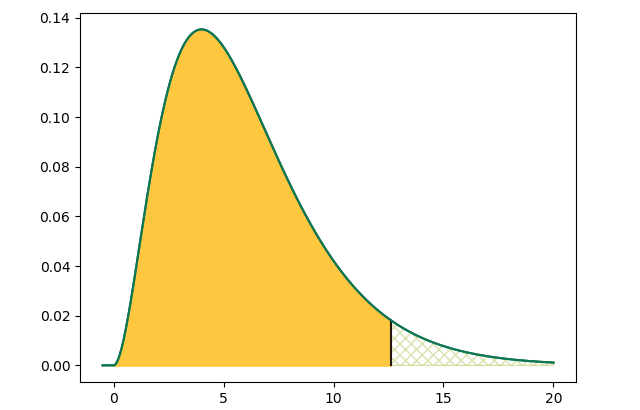
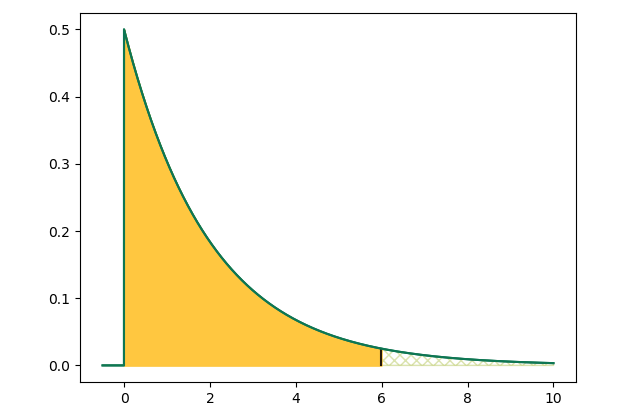
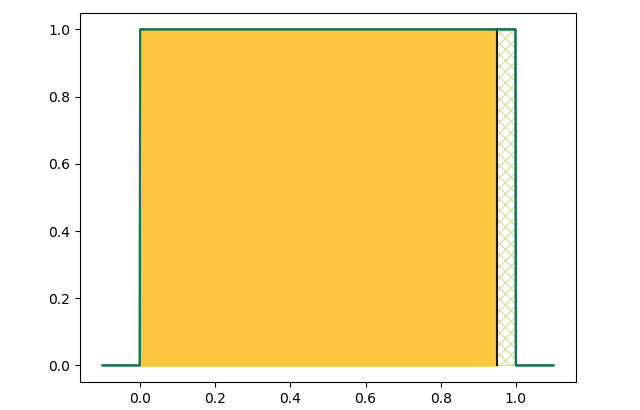
These models know how things would look if we netted fish (or timed trains, or pulled marbles out of a bag) FOREVER
This is no small thing. You might or might not know that it is twice as easy to net 3 red fish out of 5 than it is to net 4 red fish out of 5. That’s because there are 10 ways to net 3 and only 5 ways to net 4. That’s why there’s a curve in the bell curve: each draw has the same chance, but totals in the middle are more likely. For five fish, this is easy enough to calculate, but even a computer would be quickly overwhelmed trying to count its way to the difference in likelihood at commercial scales.
Here is the curve mapping how many red fish you’d expect to net if you netted 16 fish—IF your pond were still stocked 50:50.
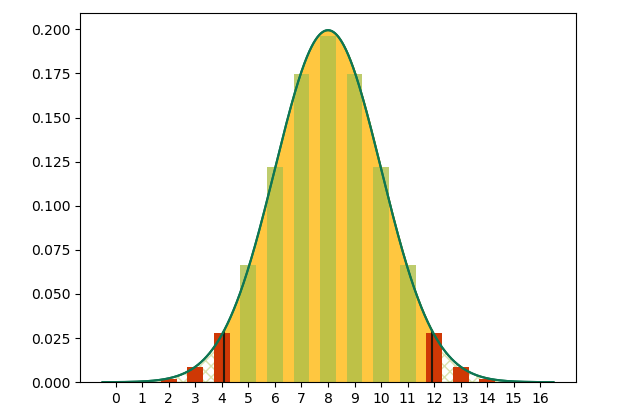
This model, like the ones above, has a yellow area covering 95% of conceivable outcomes. 95% is a typical statistical test boundary.
Did you notice the red bars outside the yellow area? Those red bars are what we shouldn’t see.
We’ve modeled random chance, and random chance shouldn’t produce those outcomes (not more than once in twenty anyway). If we get a red outcome, one of two things has probably happened:
- our model parameters have always been wrong (have we forgotten that we stocked the pond at 70:30, not 50:50?)
- something besides chance is affecting our result.
So our model is probably wrong. In statistical terms, we “reject” the assumption that there are currently 50% red and blue in our pond.
Note: 95% may seem like a high burden of “proof”, but remember that in practice, you’d be performing such tests on something every day. With a lower boundary, you’d be rejecting all the time.
The statistical test
Your model is a set of assumptions. Your statistical test looks at the likelihood of your outcome UNDER THOSE ASSUMPTIONS. If the likelihood is low, you reject your assumptions. This beats the heck out of the way humans tend to reject assumptions (usually recency bias).
The test is a formula, which—don’t miss this—looks at not only the ratio of fish in your net, BUT THE NUMBER AS WELL.
Looking back to the last image (netting 16 fish), we see that you might change your assumptions if 2/3 of your fish were red or blue. If you only net 8 fish, however …
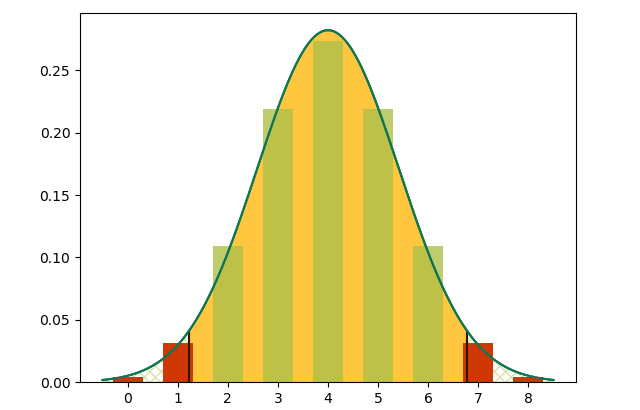
… you’ll need more than 3/4 of one color to change your assumptions. And if you only net 3 …
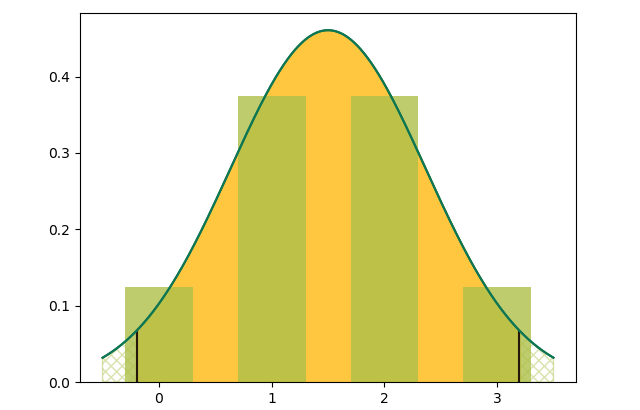
… you couldn’t justify changing your assumptions no matter what was in your net. This is where it gets tough in safety, because in safety, we count BAD things, and fortunately, we don’t have many BAD things to count. In safety, we more often have to live by “It’s not IF, it’s WHAT IF?” and make our decisions that way.


